DSMC-Neutrals Case Study - Dust Particle Simulation
DSMC-Neutrals is a 3D rarefied gas analysis software package that utilizes the Direct Simulation Monte Carlo (DSMC) method. By employing an unstructured mesh, it enables simulations of complex geometries. It also supports chemical reaction calculations, making it suitable not only for simulating rarefied gas flows within vacuum chambers but also for modeling thin-film deposition in semiconductor manufacturing processes such as Chemical Vapor Deposition (CVD). If reading this article has made you even slightly interested in rarefied gas analysis or gas flow simulation, please feel free to contact us at any time to request materials or for further information.
Dust Particle Motion Simulation
There is a method for controlling dust that affects contamination using thermophoresis.
Here, we present a simulation of the thermophoretic forces acting on dust particles, which are microsized.
We use DSMC-Neutrals to calculate the thermophoretic force of a 1-μm-diameter particle.
Typically, because the particle diameter is large, the time step must be small, resulting in unrealistically long computation times.
Therefore, we incorporated a weighting factor for the momentum transfer experienced by the particle during collisions with the ambient gas.
By accounting for this weighting in momentum transfer, calculations with larger time steps become possible,
allowing the simulation of particle behavior within a realistic computational timeframe.
The following example of a thermophoresis calculation demonstrates that the collision calculations are performed correctly.
Here, the time step is approximately one million times larger than that used in standard DSMC collision calculations.
Because DSMC-Neutrals can simulate the behavior of microscale particles, it is capable of calculating contamination caused by dust within a chamber.
The following case study demonstrates that DSMC-Neutrals can be used to simulate the suppression of contamination caused by thermophoresis.
The figure below shows a computational model of thermophoresis. Particles are generated on the left side of the figure and reach the wall on the right via thermophoresis. The thermophoretic force is calculated based on the change in the particles’ velocity.
Note that this computational model neglects the drag force (air resistance) acting on the particles.
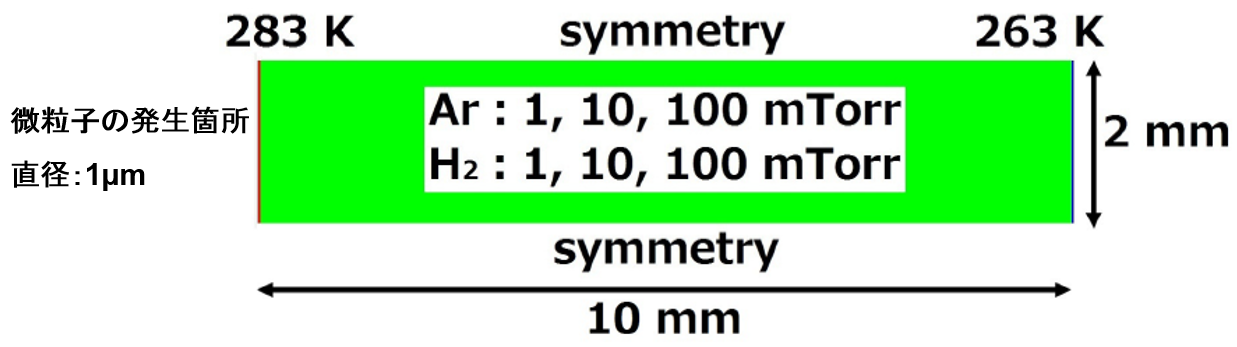
▲ Computational Domain and Boundary Conditions. A particle with a diameter of 1 μm is generated at the leftmost edge of the domain.
The figure below shows a graph of the pressure dependance of the thermophoretic force. The solid line represents the analytical solution by Gallis et al., while the squares and triangles represent the results from DSMC-Neutrals. It can be seen that the DSMC-Neutrals simulation results closely match the analytical solution.
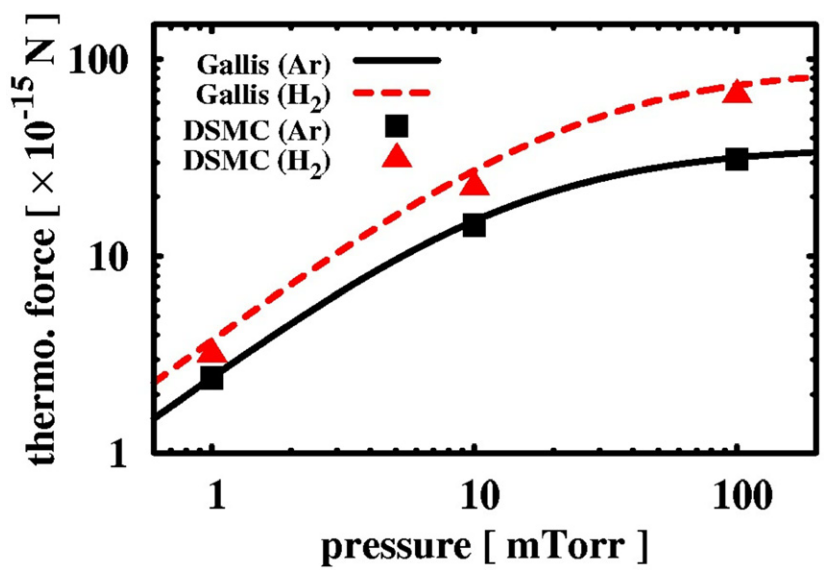
▲ Pressure Dependence of Thermophoretic Force
In regions with a temperature gradient, particles move at a constant velocity due to the balance between thermophoretic force and resistance. This velocity is called the thermophoretic velocity and can be estimated using Waldmann's thermophoretic velocity equation. The particle model in DSMC-Neutrals reproduces Waldmann's thermophoretic velocity. The figure below shows a graph of the thermophoretic velocity calculated using DSMC-Neutrals.
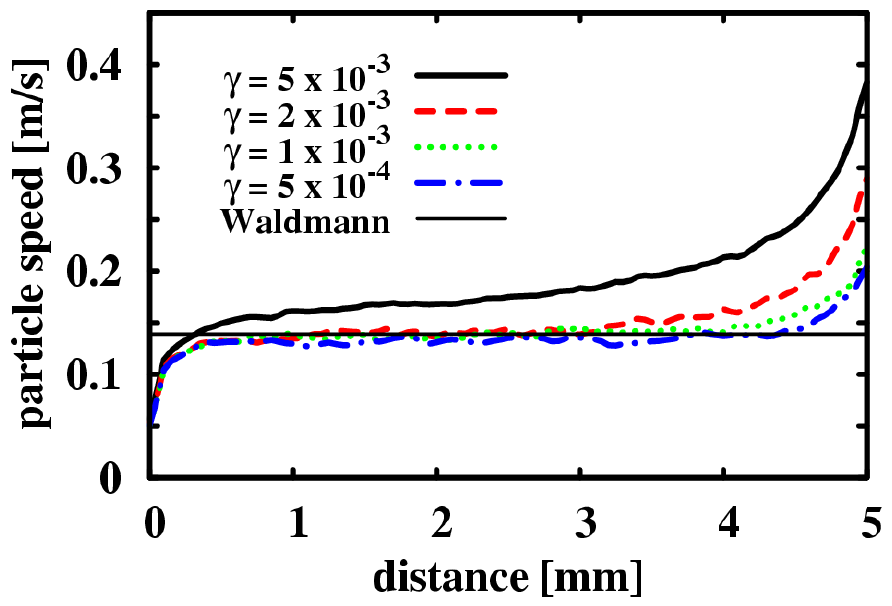
▲ Thermophoretic Velocity
Next, we present the computational results for the behavior of polystyrene particles compared with experimental data. The computational results for polystyrene particles ejected at 8.5 m/s as they reach the substrate while experiencing drag are shown below. Experiments have reported that applying a temperature gradient of 10 K/cm prevents the particles from reaching the substrate (top side of the figure). As shown in the calculation results below, the DSMC-Neutrals simulation also exhibits a temperature distribution similar to the experiment; in case (b), the results indicate that many particles are being pushed back.
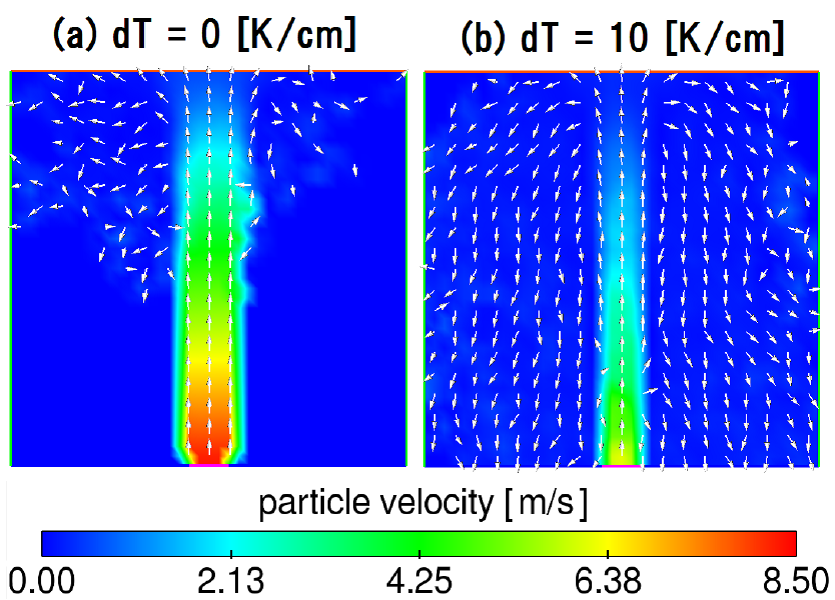
▲ Velocity Distribution of Polystyrene Microparticles
Finally, we present a simulation of dust being stirred up by the inflow. The chamber dimensions are 1 × 1 × 1 m. The figure below shows the simulation results of dust particles with a diameter of 1 μm being stirred up by an inflow of 280 slm of argon gas through a 5-mm-diameter nozzle. The contours and vectors in the left figure represent the pressure and velocity vector of the argon gas, respectively. The figure on the right shows the dust density distribution. It can be seen that the dust is stirred up due to the rapid inflow of gas from the right side of the figure, and that the stirred-up dust is then forced against the right side of the figure by the inflowing gas. By calculating the behavior of the dust, it is possible to investigate its impact on contamination.
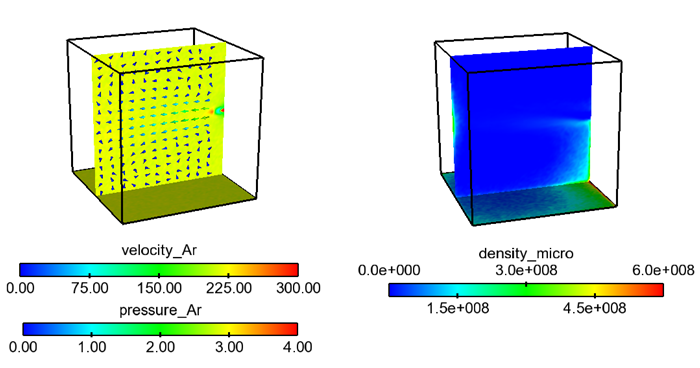

▲ Dust moving and diffusion by gas inflow from right side
Reference
-
Takao Wada, Journal of Fluid Science and Technology, vol.11, No.3, 00221 (2016),
https://www.jstage.jst.go.jp/article/jfst/11/3/11_2016jfst0013/_article

-
Takao Wada, J. Appl. Phys. vol.116, 44502 (2014),
http://dx.doi.org/10.1063/1.4890712